How to Do Social Media Graphics Automation At Scale Using Claude
Automate social media graphics at scale using Claude, Templated MCP, reusable templates, and spreadsheet-driven content

In this article
AI is already becoming part of the normal content production workflow. According to Templated’s social media automation report, 80% of marketers use AI for content creation, while 75% use it for media production.
That matters because creating the content is only one part of social media marketing. You still need to turn that content into branded graphics, update the copy and product visuals, and create multiple versions without manually editing every post.
In this tutorial, I’ll show you how to automate that process using Claude as the AI agent and Templated through its MCP server. Similar AI-powered workflows can also extend to voice-based tasks through an AI voice agent, helping automate spoken interactions alongside content creation.
We’ll create one reusable LinkedIn template, give Claude a spreadsheet containing different product features, headlines, descriptions, benefits, CTAs, and visual instructions, and let it generate multiple branded graphics from the same design.
For the example, I’m using a fictional CRM called Nexora CRM. Each spreadsheet row represents a different feature, such as Lead Management, Email Sequences, Sales Reporting, or Workflow Automation.
The branding and layout stay the same, while the copy and product visuals change for each post.
What you'll need
- An account on Templated
- Claude with the Templated connector enabled
- A Google Sheet or spreadsheet with your content
I’m using LinkedIn graphics here, but you can use the same workflow for other recurring social media formats as well.
Now, let’s build it.
Step 1: Connect Templated to Claude
Before we create anything, Claude needs access to Templated.
Start by creating a free Templated account. You can sign up here: Create a Templated account
Once you're inside the dashboard, open the API Key section and copy your API key. We'll use it to authenticate the Templated MCP server  Next, go to the Templated AI Agents page and select Get Custom Connector Link or Claude Code. I’m using the custom connector link to connect my Templated account to Claude.
  Next, open Claude and click the + button beside the chat box.
Go to: Connectors → Add connector → Add custom connector  Now add the MCP server URL: https://mcp.templated.io/mcp Paste that URL into Claude when adding the custom connector, and give it a name. I gave Templated AI agent here.
  Once the connector is added, enable Templated AI Agent from the Connectors menu. Now we will authenticate with your API key so that Claude can directly access your Templated account and make changes directly from the chat.
Give Claude this simple prompt -
"env": {
  "TEMPLATED_API_KEY": "add your API key here"
}
Use the connected Templated tools. Before creating anything, confirm that you can access my Templated account and create templates. Then create the Nexora CRM LinkedIn template using the brand and design instructions below.
The first time Claude uses the connector, it will ask you to allow access or authorize the Templated tools. Approve it.
Once Claude confirms that it can access your Templated account, the connection is ready.  Now Claude can use Templated directly from the conversation, which is what we'll use in the next step to create the reusable LinkedIn template.
To know more about the integration, you can read this MCP integration document.
Step 2: Create Your Reusable Social Media Template
Now that Templated is connected to Claude, you can create the template directly from the Claude chat.
Before you start, decide exactly how you want the design to look. The more specific you are, the better the result.
Think about:
- Canvas size
- Brand colors and HEX codes
- Font style and size
- Logo placement
- Headline, description, benefits, and CTA
- Product visual area
- Which elements should stay fixed
- Which elements should change for every post
For this example, I’m creating a 1080 × 1350 px LinkedIn feature-post template for Nexora CRM.
I also defined the editable layers clearly:
feature_name
headline
description
point_1
point_2
point_3
cta
feature_visual
You can also upload your logo or a reference design to Claude. If needed, describe your idea first and ask Claude to turn it into a detailed design prompt.
Once your prompt is ready, send it in the Claude chat with the Templated connector enabled. Approve any tool-access request it shows.
Claude will create the template directly in your Templated account. And, send you the link to check it directly. This is the link and how the Template turned out. 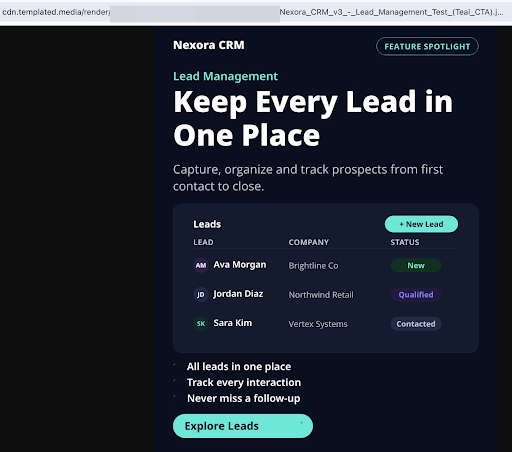
The finished template will appear in your Templated dashboard, where you can open it in the editor and adjust individual layers, font sizes, spacing, images, or anything else.
Once the template looks right, we can move on to preparing the spreadsheet data that will generate all the different variations.
Step 3: Organize the Data Around Your Template
Open the template in Templated before you build the spreadsheet. The layer panel shows exactly which parts of the design can change from one social post to the next.
In my template, I have layers such as feature_name, headline, description, point_1, point_2, point_3, cta, and feature_visual.
I used those layer codes as the column headers in the sheet, so Claude knows which piece of content belongs where. 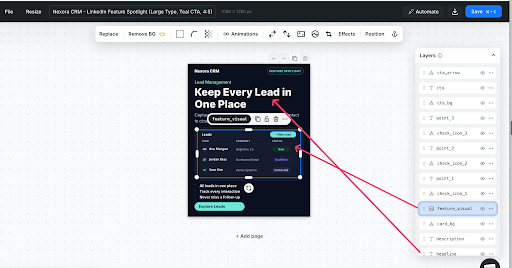
The structure is fairly simple:
- Each column maps to an editable layer in Templated.
- Each row contains the content for one new social media graphic.
So one row can produce a Lead Management graphic with its own headline, description, feature points, CTA, and product screenshot. The next row can use the same design for Sales Pipeline, while changing every piece of content tied to those layers.
Images need their own field too. In my sheet, the visual column contains the image assigned to each graphic, such as lead-dashboard.png, pipeline.png, or reporting.png. If Claude is generating those visuals earlier in the workflow, you can instead give it a clear visual instruction for each row and pass the finished image into that layer.
That is the sheet I prepared below. The important part is keeping the spreadsheet headers aligned with the layer codes in Templated, because those names become the link between your data and the final design.  Once that mapping is in place, adding more graphics mostly means adding more rows. Ten rows gives you ten posts. A much larger content set uses the same template without rebuilding every design by hand.
Step 4: Give Claude the Spreadsheet and Render the First Post
Once the sheet is ready, download it as an .xlsx or .csv file and upload it to the same Claude chat where Templated is connected.
You also need the template ID from the template you created earlier. Claude will use that ID to work on the existing design instead of making a new one.
The prompt will depend on your template and the layers you created. Here’s the one I used for Nexora CRM:
I’ve attached a spreadsheet containing the content for my LinkedIn feature graphics.

Use the connected Templated tools and this existing template:
__Template ID__: [YOUR_TEMPLATE_ID]

Do not create a new template or change the main design.

Each spreadsheet row should create one separate graphic.

Match these spreadsheet columns with the existing Templated layers:

feature_name → feature_name
headline → headline
description → description
point_1 → point_1
point_2 → point_2
point_3 → point_3
cta → cta
visual → feature_visual

Keep the branding, colors, fonts, layout, dimensions, and CTA styling unchanged.

For the visual column, treat the value as a description of the product visual I need. Do not show the filename or replace it with placeholder text.

Create an actual SaaS UI visual for that feature inside feature_visual.

A Lead Management row should show a leads interface with names, companies, and statuses. A Sales Pipeline row should show a pipeline with deal stages. Email Sequences should show email steps and wait periods. Sales Reporting should show readable charts and sales metrics.

Keep all of these visuals in the same Nexora CRM product style.

If any text is too long for the template, shorten the copy instead of reducing the font size.

First read the spreadsheet and confirm the rows and layer mapping. Then render __only the first row__ so I can check it before you continue.

I prefer testing one row first. A wrong layer name or an overcrowded visual is much easier to fix once than after Claude has rendered 100 images.
Once the first graphic looks right, tell Claude:
The first render looks good. Now use the same template, layer mapping, and visual style for all remaining spreadsheet rows. Generate one graphic per row and return the render link for each one.
Your prompt does not need to look exactly like mine. Change the layer names, visual instructions, and rules based on the template you built.
Step 5: Review and Download the Rendered Graphics
Once Claude finishes processing the spreadsheet, it will return the render links for the graphics it created.
Open a few of them first and check that the copy, CTA, and product visual look right. 
 You can also open your Templated dashboard and go to the renders section. Every generated graphic will appear there, so you can review them together and download the ones you need.
  As shown in the screenshot, every graphic renders correctly inside the same template, with a different product visual created for each feature based on the instructions in the spreadsheet and prompt.
The layout, colors, typography, and branding should stay the same across every render. The headline, feature points, CTA, and product visual change based on each spreadsheet row.
For this tutorial, I’m stopping at graphic generation, but you can extend the automation further into a much larger social media automation setup, from writing LinkedIn text posts to scheduling the post to get analytics. Covered next.
What You Can Automate After the Graphics Are Ready
Once your graphics are rendered, the workflow can continue well beyond downloading the files.
You can ask Claude to collect the final render URLs along with the feature name, headline, and other campaign data in a table or spreadsheet. If Claude also has access to Google Sheets, those results can be written back into the same sheet.
Claude can then write the LinkedIn caption for each graphic using the data from the corresponding row.
From there, you can use a LinkedIn posting API to publish or schedule the image and caption. After the posts go live, you can also pull available analytics such as impressions, engagement, clicks, and other performance data back into your workflow.
That gives you a much more complete loop:
Spreadsheet → Claude → Templated graphic → LinkedIn caption → LinkedIn Posting and Analytics API → Data in spreadsheet
You could even feed those results back into the spreadsheet and use Claude to compare which headlines, features, or post formats performed better before creating the next batch.
Conclusion
You can see how quickly one template can turn into a full batch of branded graphics once Claude and Templated are connected. If you already use Claude, this gives you a practical way to cut out a lot of the repetitive work that normally comes with creating content for any social media platform Instagram, Facebook, LinkedIn, and more at scale.
And this is only one use case for MCP. If you work in marketing, I’ve also put together a list of the MCP servers I use for things like SEO research, creative production, social publishing, and analytics. Connecting a few of the right tools to Claude can remove a surprising amount of repetitive work when your workload starts growing.
If you want to try the workflow from this tutorial, Signup to Templated and get 50 free credits to test it. If you already use Claude, you can build the template, run a few renders, and see how well the setup fits your work before moving to a paid plan.
Additional Resources
If you want to take this further, these are a few Templated tutorials I’d read next.